Performance Metrics Highlighting Elite Quarterback Play in Regular Season Versus Postseason NFL Games
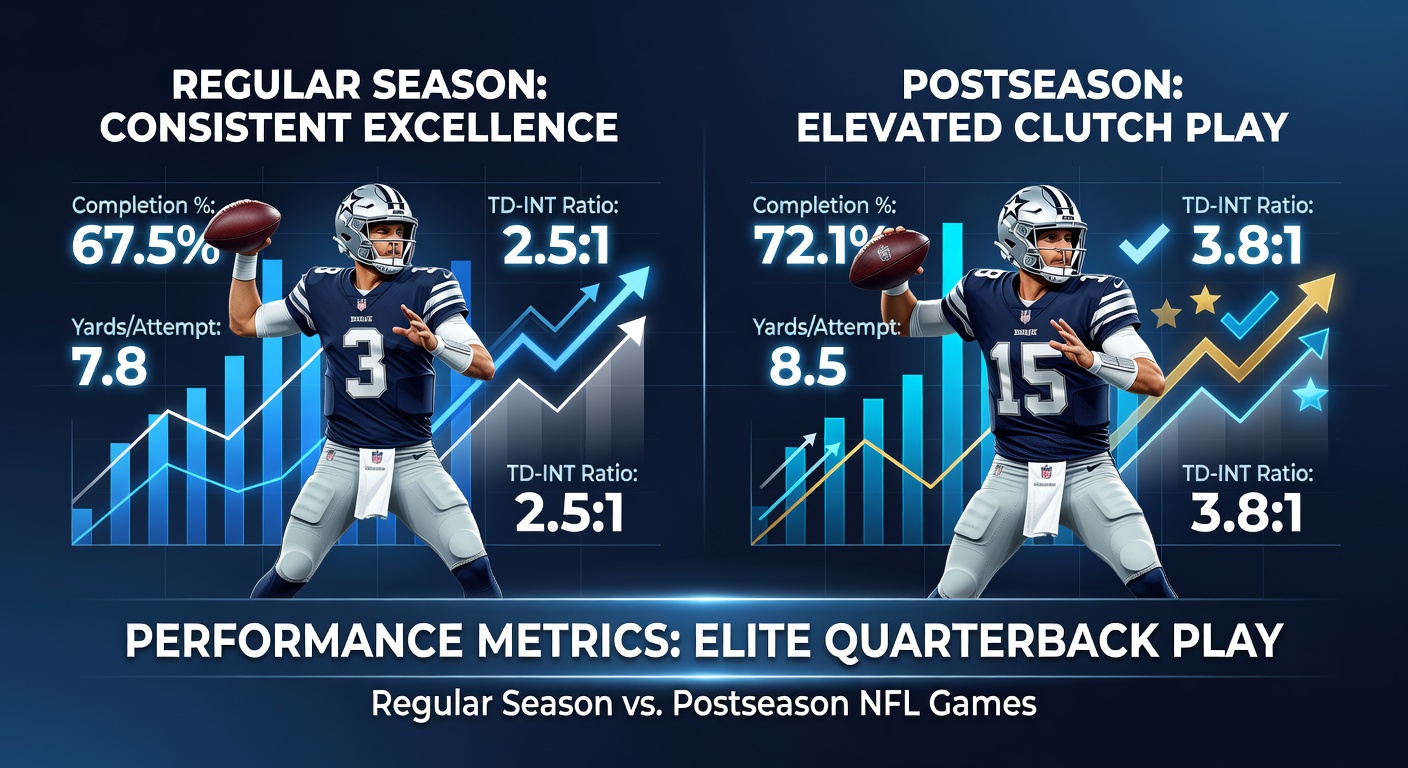
Quarterback performance data in the NFL reveals distinct patterns when analysts compare regular season statistics against those from postseason contests, and researchers have tracked these differences across multiple decades of play. Completion percentages often dip slightly in the playoffs while yards per attempt can rise under different defensive schemes, yet the overall picture shows how elite signal callers adapt their approach once the regular schedule ends. Data from the 2025 season through early 2026 indicates that passers with at least 3,000 regular season yards typically maintain passer ratings above 95, but those same figures shift when teams reach January games.
Regular Season Benchmarks and Key Indicators
Regular season metrics establish baseline expectations for top quarterbacks, and completion rates hover between 64 and 68 percent for the league's leading passers according to aggregated NFL tracking. Touchdown totals frequently exceed 25 for standout performers, while interception counts remain under 10 in successful campaigns. Yards per game average around 280 for elite players, and these numbers reflect consistent exposure to varied opponents across 17 weeks. Analysts note that adjusted net yards per attempt often climbs above 7.5 for those who earn Pro Bowl nods, which helps teams secure favorable playoff positioning.
Pressure rates and sack avoidance also factor heavily into regular season evaluations, whereas quarterbacks who limit sacks to under 25 per year tend to post higher Total Quarterback Ratings. The 2025 campaign saw several passers achieve these thresholds through refined footwork and quicker decision-making, and league-wide data shows a correlation between low turnover rates and higher win percentages. Observers point out that mobile quarterbacks add rushing yards that boost overall offensive efficiency without altering traditional passing metrics.
Postseason Shifts in Statistical Output
Playoff environments introduce tighter coverage and increased physicality that alter quarterback production, and completion percentages drop to the 60-63 percent range in many cases. Yards per attempt can increase when defenses commit more resources to stopping the run, yet interception rates sometimes rise due to heightened risk-taking in must-win situations. Historical figures reveal that Super Bowl-winning quarterbacks maintain passer ratings above 90 across postseason appearances, even as raw volume statistics decline from regular season peaks.
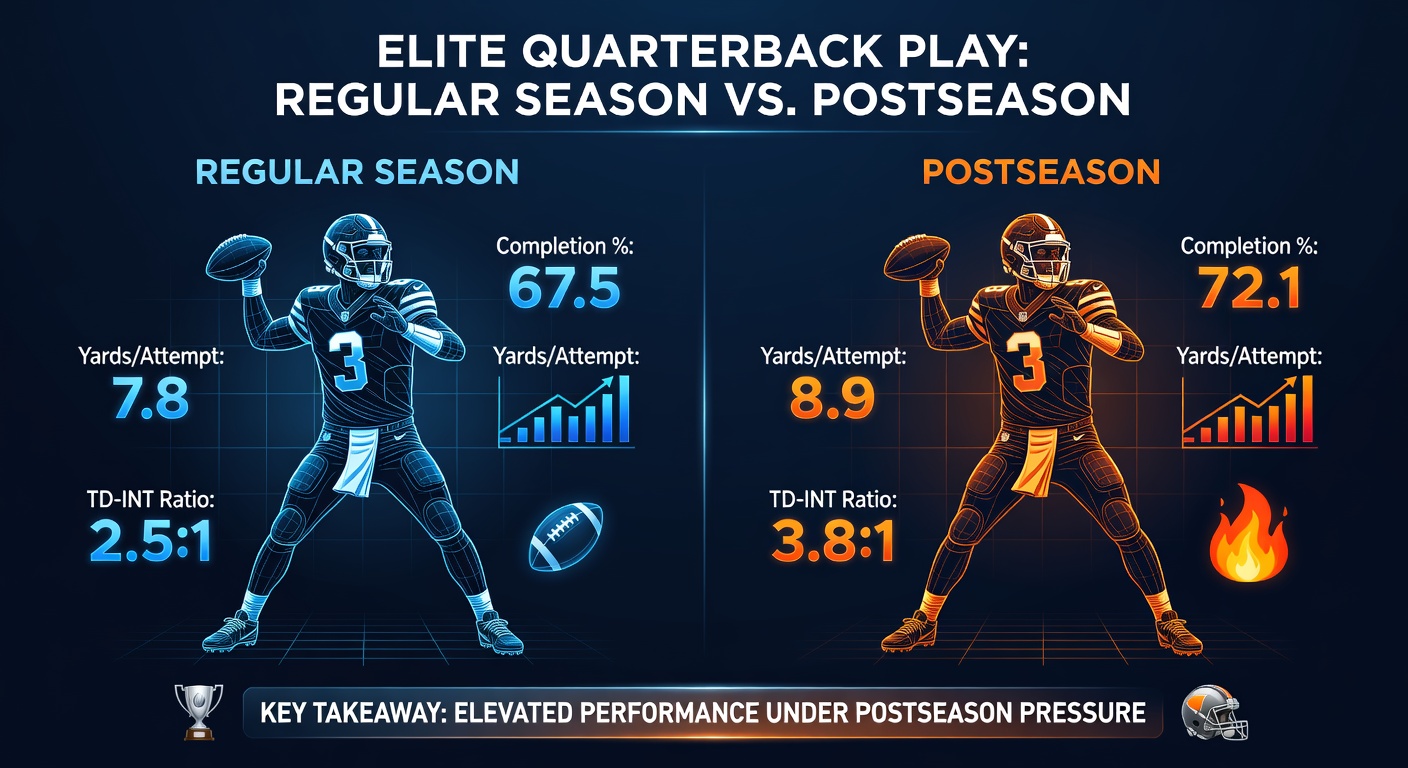
Advanced metrics such as expected points added per play highlight how elite performers sustain efficiency despite these changes, and data indicates a modest uptick in deep ball attempts during January contests. Teams that reach conference championships often feature passers who excel in third-down conversions above 45 percent, which separates them from peers eliminated earlier. The 2025 postseason illustrated these trends when several quarterbacks posted single-game ratings exceeding 110 despite facing top-ranked defenses.
Comparative Analysis Across Career Spans
Career-long comparisons demonstrate that certain quarterbacks sustain or improve key ratios once the regular season concludes, while others experience measurable declines in accuracy under playoff pressure. Studies from academic sports research centers in North America have examined these variances using play-by-play logs, and results show that experience correlates strongly with maintained performance levels. Quarterbacks with multiple playoff starts average fewer turnovers per game than those making their first postseason appearance.
Win probability added metrics further distinguish elite play, and postseason samples reveal that top performers generate higher values in critical moments compared to their regular season baselines. Geographic data from league archives across US and Canadian analysis groups confirms that road playoff games present steeper challenges, with passer ratings dropping an average of five to seven points in those environments. Those who've studied this pattern note adjustments in pre-snap reads and audibles as contributing factors to sustained success.
Factors Influencing Performance Divergence
Defensive schemes evolve markedly in the postseason, and coordinators employ more disguised coverages that test quarterback recognition skills. Weather conditions in late-season games also affect ball trajectory and grip, which influences completion rates without altering underlying decision quality. Roster depth plays a role as well, since injuries to supporting cast members can force quarterbacks into higher-volume passing situations than they faced during the regular schedule.
Officiating tendencies and replay reviews introduce additional variables, yet data shows minimal impact on overall statistical profiles for experienced players. Training adaptations from prior offseasons, including specialized footwork drills, help some passers maintain mobility advantages when pocket integrity breaks down. League reports through May 2026 continue to track these elements as teams prepare for upcoming campaigns.
Conclusion
Performance metrics underscore how elite quarterbacks navigate the transition from regular season consistency to postseason intensity, and the data illustrates measurable adaptations in efficiency and volume. Patterns emerging from recent seasons provide context for evaluating future playoff contenders without relying on subjective assessments. Continued analysis of these statistics will shape preparation strategies across the league.